
Key Boxing Stats That Sharpen Your Betting Edge
 Available in US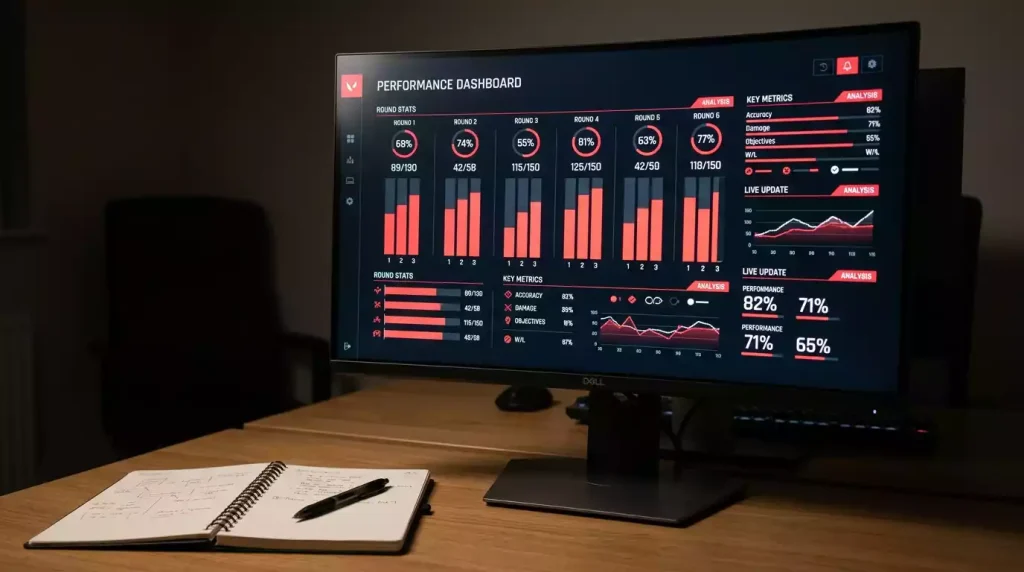
Numbers changed my boxing betting. Not the obvious numbers — win-loss records are practically useless on their own — but the granular fight metrics that reveal what a boxer actually does in the ring. Punch accuracy, output rate, jab percentage, power shot landing rate, rounds averaged per fight. These are the stats that separate an informed bet from an educated guess. I started tracking fight stats systematically about seven years ago, and the transition from narrative-driven betting to data-informed betting improved my return on investment by roughly 12% in the first year alone. The data does not replace watching fights. It tells you where to look when you do.
Punch Output and Accuracy: The Numbers That Matter Most
A fighter’s record tells you how many times they won. Punch output tells you how they won. The average professional boxer throws between 40 and 70 punches per round, but the variation within that range separates pressure fighters from counter-punchers, volume boxers from precision strikers. A fighter who averages 65 punches per round creates constant scoring opportunities and tends to win rounds on activity even when their accuracy is mediocre. A fighter who averages 35 punches per round needs higher accuracy and cleaner shots to win rounds because the judges see fewer moments of engagement.
Accuracy splits the story further. Overall accuracy in professional boxing hovers around 30% to 40%, but the jab accuracy and power shot accuracy tell different tales. A jab accuracy above 35% indicates a fighter who controls distance effectively and uses the jab as a genuine weapon rather than a range-finder. Power shot accuracy above 45% suggests a fighter who picks their moments and commits only when the opening is genuine. Both metrics feed directly into bet selection: high jab accuracy favours the decision market, while high power accuracy favours the stoppage market.
The UK gambling industry generates 16.8 billion pounds in gross gambling yield annually, and the portion flowing into boxing reflects a growing appetite for data-driven betting. Bookmakers use aggregated punch stats in their models, but the level of granularity available to individual bettors now matches or exceeds what the bookmakers themselves use. The asymmetry is not in data access — it is in interpretation. Two bettors looking at the same punch stats will reach different conclusions depending on how they weight accuracy versus volume, jab versus power, and offence versus defence.
Defensive Metrics and Why They Are Undervalued
I backed a fighter two years ago whose offensive stats looked ordinary — middling punch output, average accuracy, no exceptional power numbers. His defensive stats, though, were extraordinary. Opponents landed fewer than 20% of their total punches against him, and his power shot evasion rate was above 75%. He was not exciting to watch, but he was nearly impossible to hit cleanly. The bookmaker had him as an underdog because his record included several close decisions and his highlight reel was thin. The market was pricing entertainment value, not ring effectiveness. He won a comfortable decision at 7/4.
Defensive stats — punches received per round, opponent accuracy against, evasion rate on power shots — are the most undervalued metrics in boxing betting. The public loves offence. Knockouts sell tickets and drive betting interest. A fighter who makes opponents miss does not generate social media clips, which means they generate less public betting support, which means their odds stay longer than they should be. I weight defensive metrics heavily in my analysis, particularly for decision-market bets where the fighter’s ability to avoid damage directly correlates with their ability to stay sharp in the championship rounds.
Chin durability is the defensive stat you cannot measure directly but can infer from the data. A fighter who has absorbed high power shot percentages over multiple fights without being hurt demonstrates durability that should factor into your stoppage probability estimates. If Fighter A lands power shots at 50% accuracy and Fighter B has absorbed similar power from previous opponents without being stopped, the KO/TKO probability is lower than the headline power numbers suggest.
Activity Rate, Layoff Data, and Fight Frequency
How often a fighter competes matters more than most bettors realise. The number of licensed betting premises in the UK has fallen to 5,825 — a 17.8% decline over ten years — partly because online platforms deliver information faster. One piece of information that travels poorly through traditional channels is fight frequency. A fighter who competes every twelve to sixteen weeks maintains ring sharpness, timing, and the muscle memory of professional rounds. A fighter who competes twice a year spends more time in the gym than in the ring, which produces a different kind of fitness — gym-fit rather than fight-fit.
I track the interval between fights for every boxer I analyse, and the data shows a clear trend: fighters returning from layoffs of six months or more underperform their pre-fight odds in the first two rounds of their comeback fight. The ring rust effect is real and measurable, particularly in the early rounds when timing and distance calibration are still adjusting. This does not mean the inactive fighter will lose, but it does mean the live betting market after two slow opening rounds often offers better value on the comeback fighter than the pre-fight odds did.
Fight location is another overlooked stat. Some fighters perform dramatically better or worse in specific venues, on specific continents, or under specific conditions. European fighters competing in the US for the first time frequently underperform, partly because of travel fatigue and time zone adjustment, partly because of unfamiliarity with American ring officials, and partly because of crowd hostility. Travel data is not available in any standard stats package, which is exactly why it retains value. You build this dataset yourself by tracking results and noting locations.
Building Your Own Statistical Model Without a Maths Degree
You do not need a PhD in statistics to use boxing data effectively. You need a spreadsheet, consistency, and a willingness to track four or five metrics per fighter over time. My model is simple: for each fighter in a matchup I am considering, I record their last five fights’ punch output per round, accuracy, power shot accuracy, defensive evasion rate, and fight duration. I then calculate the average and compare the two fighters across those dimensions. Where one fighter holds a clear advantage on multiple metrics, the moneyline should reflect that advantage. Where the moneyline does not reflect it, I have a potential bet.
The model is imperfect. It does not capture stylistic interaction, it does not adjust for opponent quality beyond a rough mental filter, and it does not incorporate intangibles like motivation or personal circumstances. But it does what a model should do: it forces me to look at the data before I look at the odds, which prevents me from working backward from a price to justify a bet I have already decided to place. For practical steps on how to analyse a boxing fight using a combination of stats and film study, the analytical framework extends well beyond numbers alone.
Articles


Published by the RINGWAGER team.
